Reading Powell’s book about nuclear emulsion, I went on this page :
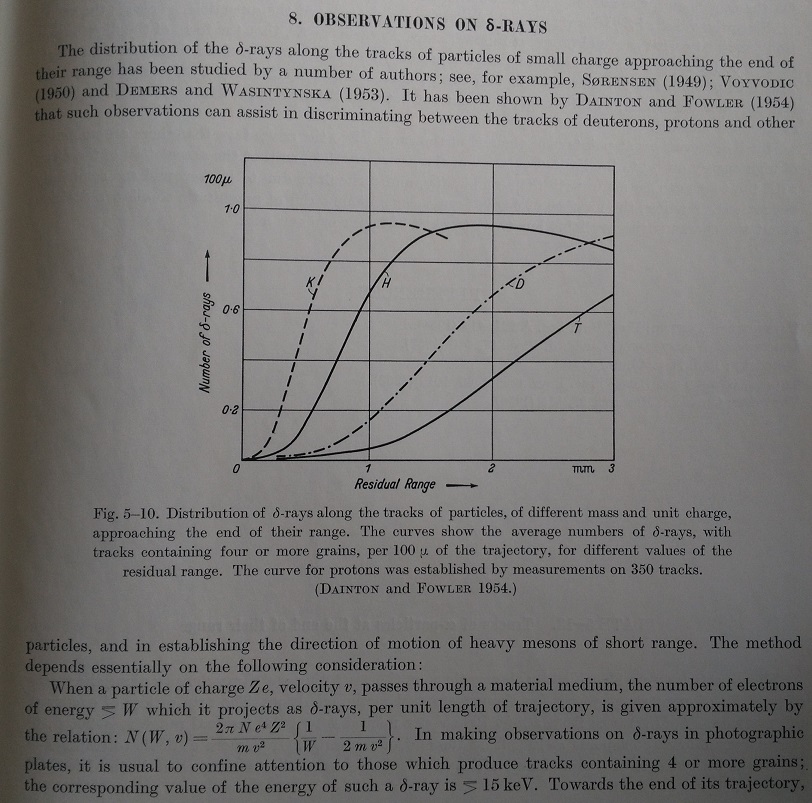
Which say that for incoming particle, delta ray are mostly produced in end of their range. « End of their range » in emulsion is about 3 mm, like the curve show. That’s what say the equation in the dE/dx page :
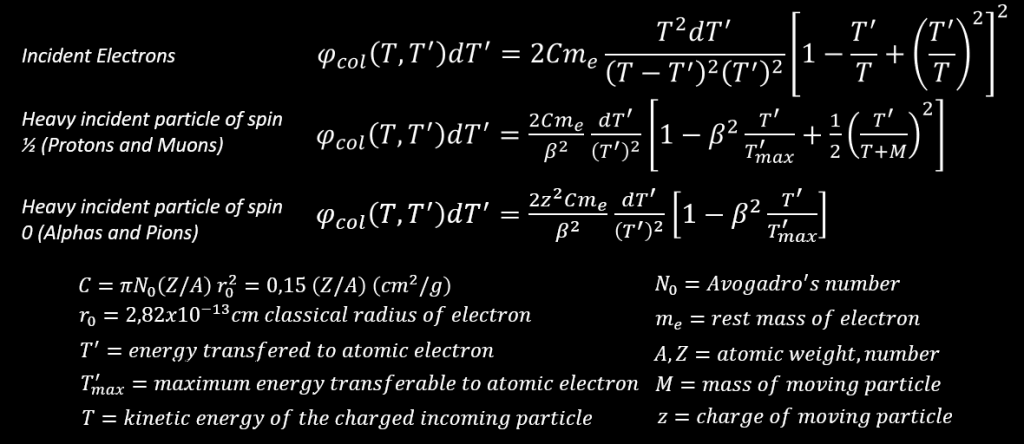
If β=v/c become low, as the velocity of incoming particle is decreasing, the probability of producing delta ray increase. But increase how much and when ? this answer is given in the curve from Powell. In photographic emulsions and for a proton, the number of delta ray produced is maximum in the last 2-3 mm of range.
As we are observing particles in cloud chamber travelling in air, I wanted to know what represent 3 mm of emulsion in term of distance of air to know if we can observe a dramatic increase of delta ray in say, 40 cm of air which can be observable in a cloud chamber.
I need to know the kinetic energy loss of a proton versus the range it can make in an emulsion. This information is given in the curve below :
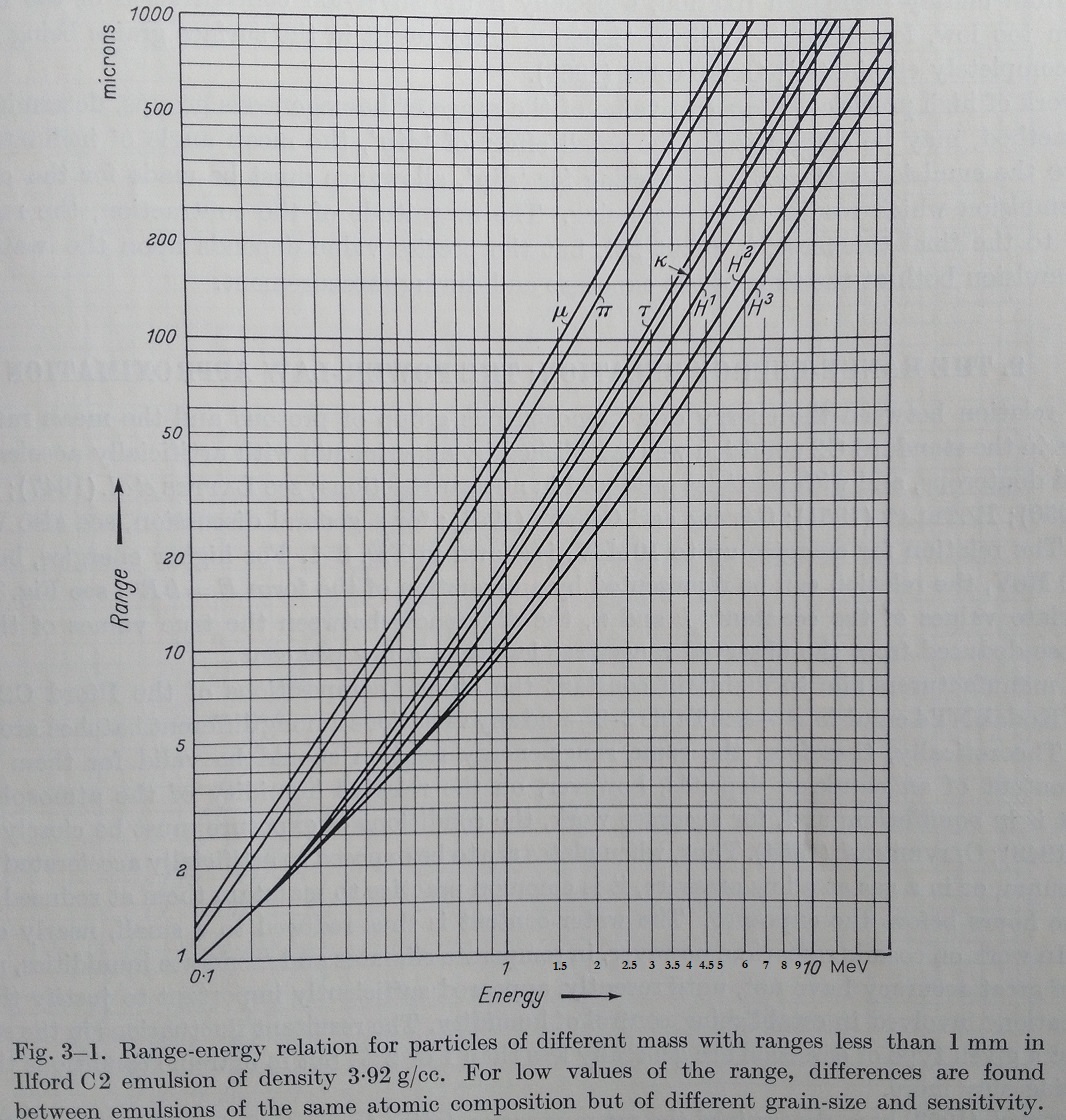
Looking at the curve, a 10 MeV proton (H1) can travel 600 microns in an emulsion of d=3,92 g/cm3.
This mean that the proton lost 10 MeV into 600 μm or 0,06 cm. That’s roughly a loss about 10/0,06 = 166 MeV/cm
Remember that stopping power is the « average rate of energy loss per unit path length, due to Coulomb collisions that result in the ionization and excitation of atoms. For heavy charged particles, the collision stopping power is often called electronic stopping power ».
Lets confirm this rough value going to NIST to obtain the stopping power in emulsion (with a density of 3,815 g/cm3), and for a proton :
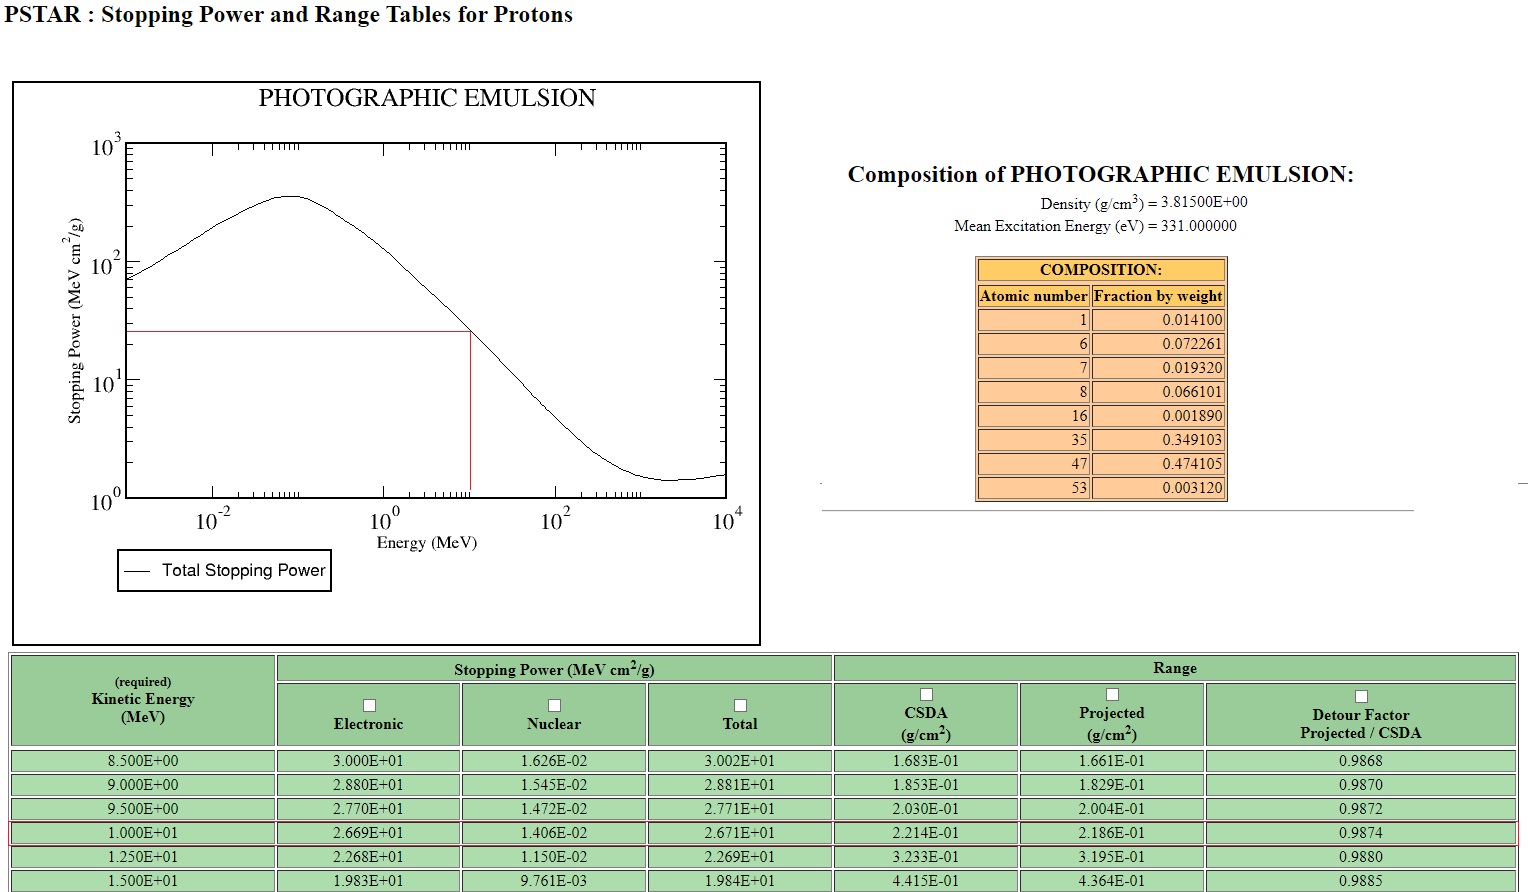
For a 10 MeV proton, the total stopping power is 2,671 E+01 MeV cm²/g. Knowing the density of emulsion is about 3,92 g/cm3 we can reach the linear stopping power doing 26,71 * 3,93 = 105 MeV/ cm. That’s in the range of our rough estimate of 166 MeV/cm. But this is a false calculation, because as the particle slow down losing energy… the stopping power increase ! so the loss is not linear. But in average, a proton of 10 MeV loose about 100 MeV/cm in a photographic emulsion.
The projected range of this proton of 10 MeV is 0,2186 g/cm². So in cm, the range is 0,2186/3,815=0,0573 cm… or 573 microns, not far from the 600 microns considered in the curve.
So, what is the energy of a proton which have a residual range of 3 mm (first curve of the page) ? The projected range in g/cm² is 3,815*0,3 = 1,14 g/cm². We just have to find this value in the table of NIST, which give me ~ 28 MeV. So a 28 MeV proton have about 3 mm of residual range in an emulsion and the production of delta ray is at its maximum, that what say the first curve of this page.
So if I observe a 28 MeV proton in a cloud chamber, I may see a large number of delta ray. What is the range of a 28 MeV proton in air ? again, let’s go to NIST choosing the medium : ‘air’ and report the value of stopping power and projected range :
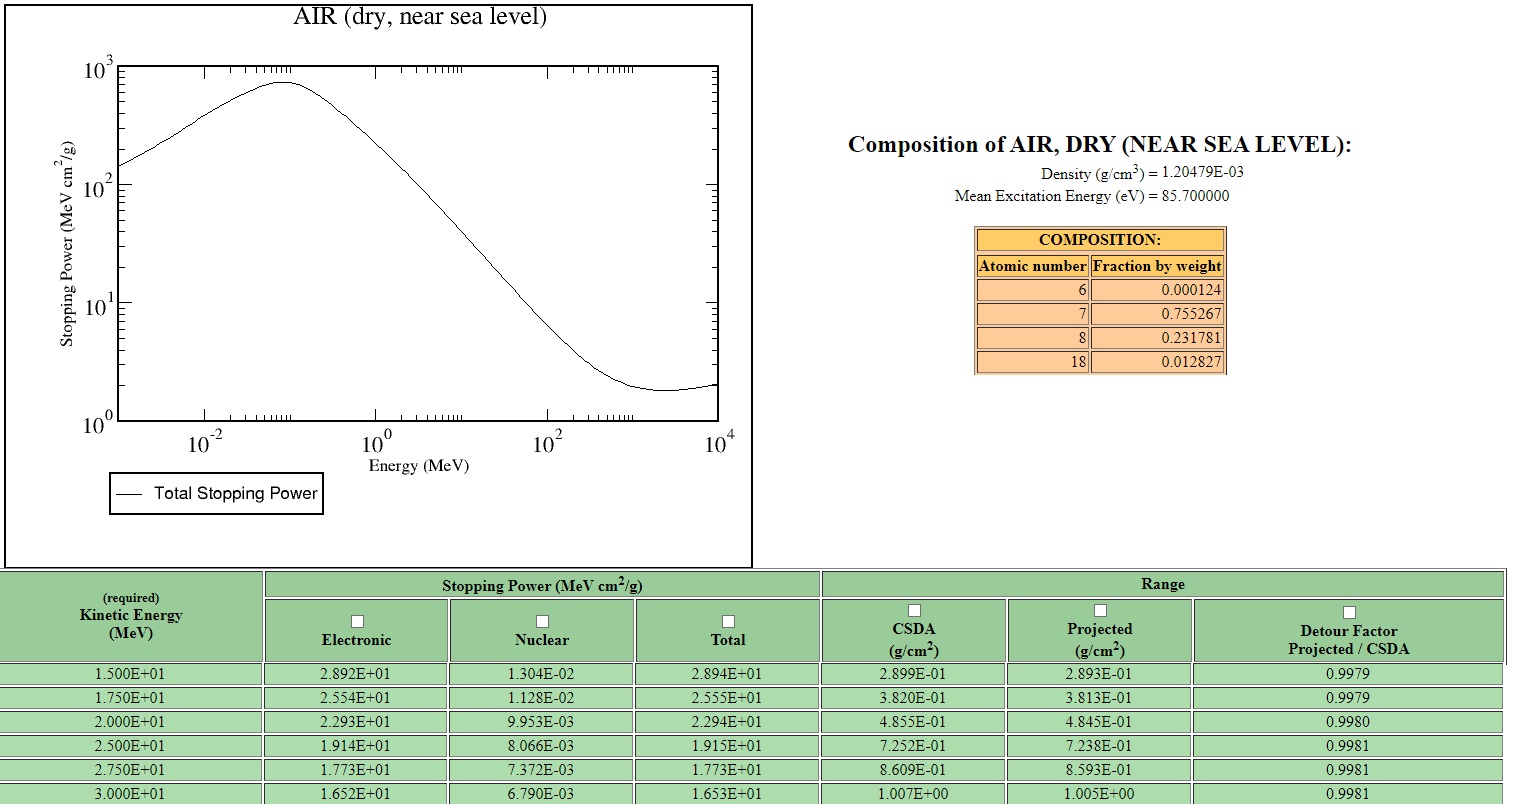
The projected range is 0,8593 g/cm² which mean that the range of a 28 MeV proton is : 0,8593/1,20479E-03=713 cm. So this is really unlikely that I can see the total lenght of track of proton of 28 MeV. It will need a 7 meter cloud chamber. I can only expect to see a portion of the tracks of a proton :
- if the proton leave a track in a cloud chamber and if it’s energy is above 28 MeV, I will likely not observe many delta ray.
- if the proton leave a track in a cloud chamber and if it’s energy is below 28 MeV, I should see delta ray, as the production is nearly at its maximum.
Note that the stopping power in emulsion for a 15 MeV proton is 19,84 MeV/cm²/g, or 75 MeV/cm (average linear energy loss). In air, a 15 MeV proton have a stopping power of 28,94 MeV/cm²/g, or 0,034 MeV/cm !
This confirm the sentence below :
« For experiments at high altitude, the stacks commonly employed in 1952 were build up of emulsions ~ 600 μm thick, a thickness which corresponds in stopping power ~ 1 m of normal air »
The ratio of linear energy loss between emulsion and air is 75/0,034 = 2205. And the ratio of 1 m to 600 μm is 1/0,0006= 1666 (about 2000) so the sentence is correct.
To summarize, the heavy density of emulsion can slow down a particle a thousand of times more than air and this allow to see the complete life of a particle in an emulsion : from it’s birth at high energy (hundred of MeV) to its end at very low energy (keV) and only in a stack of emulsion few centimetre thick. In a cloud chamber, it would be impossible to see this event, the size of the machine would be about 75 m to see a complete 100 MeV proton track.
Other curves which may be useful :
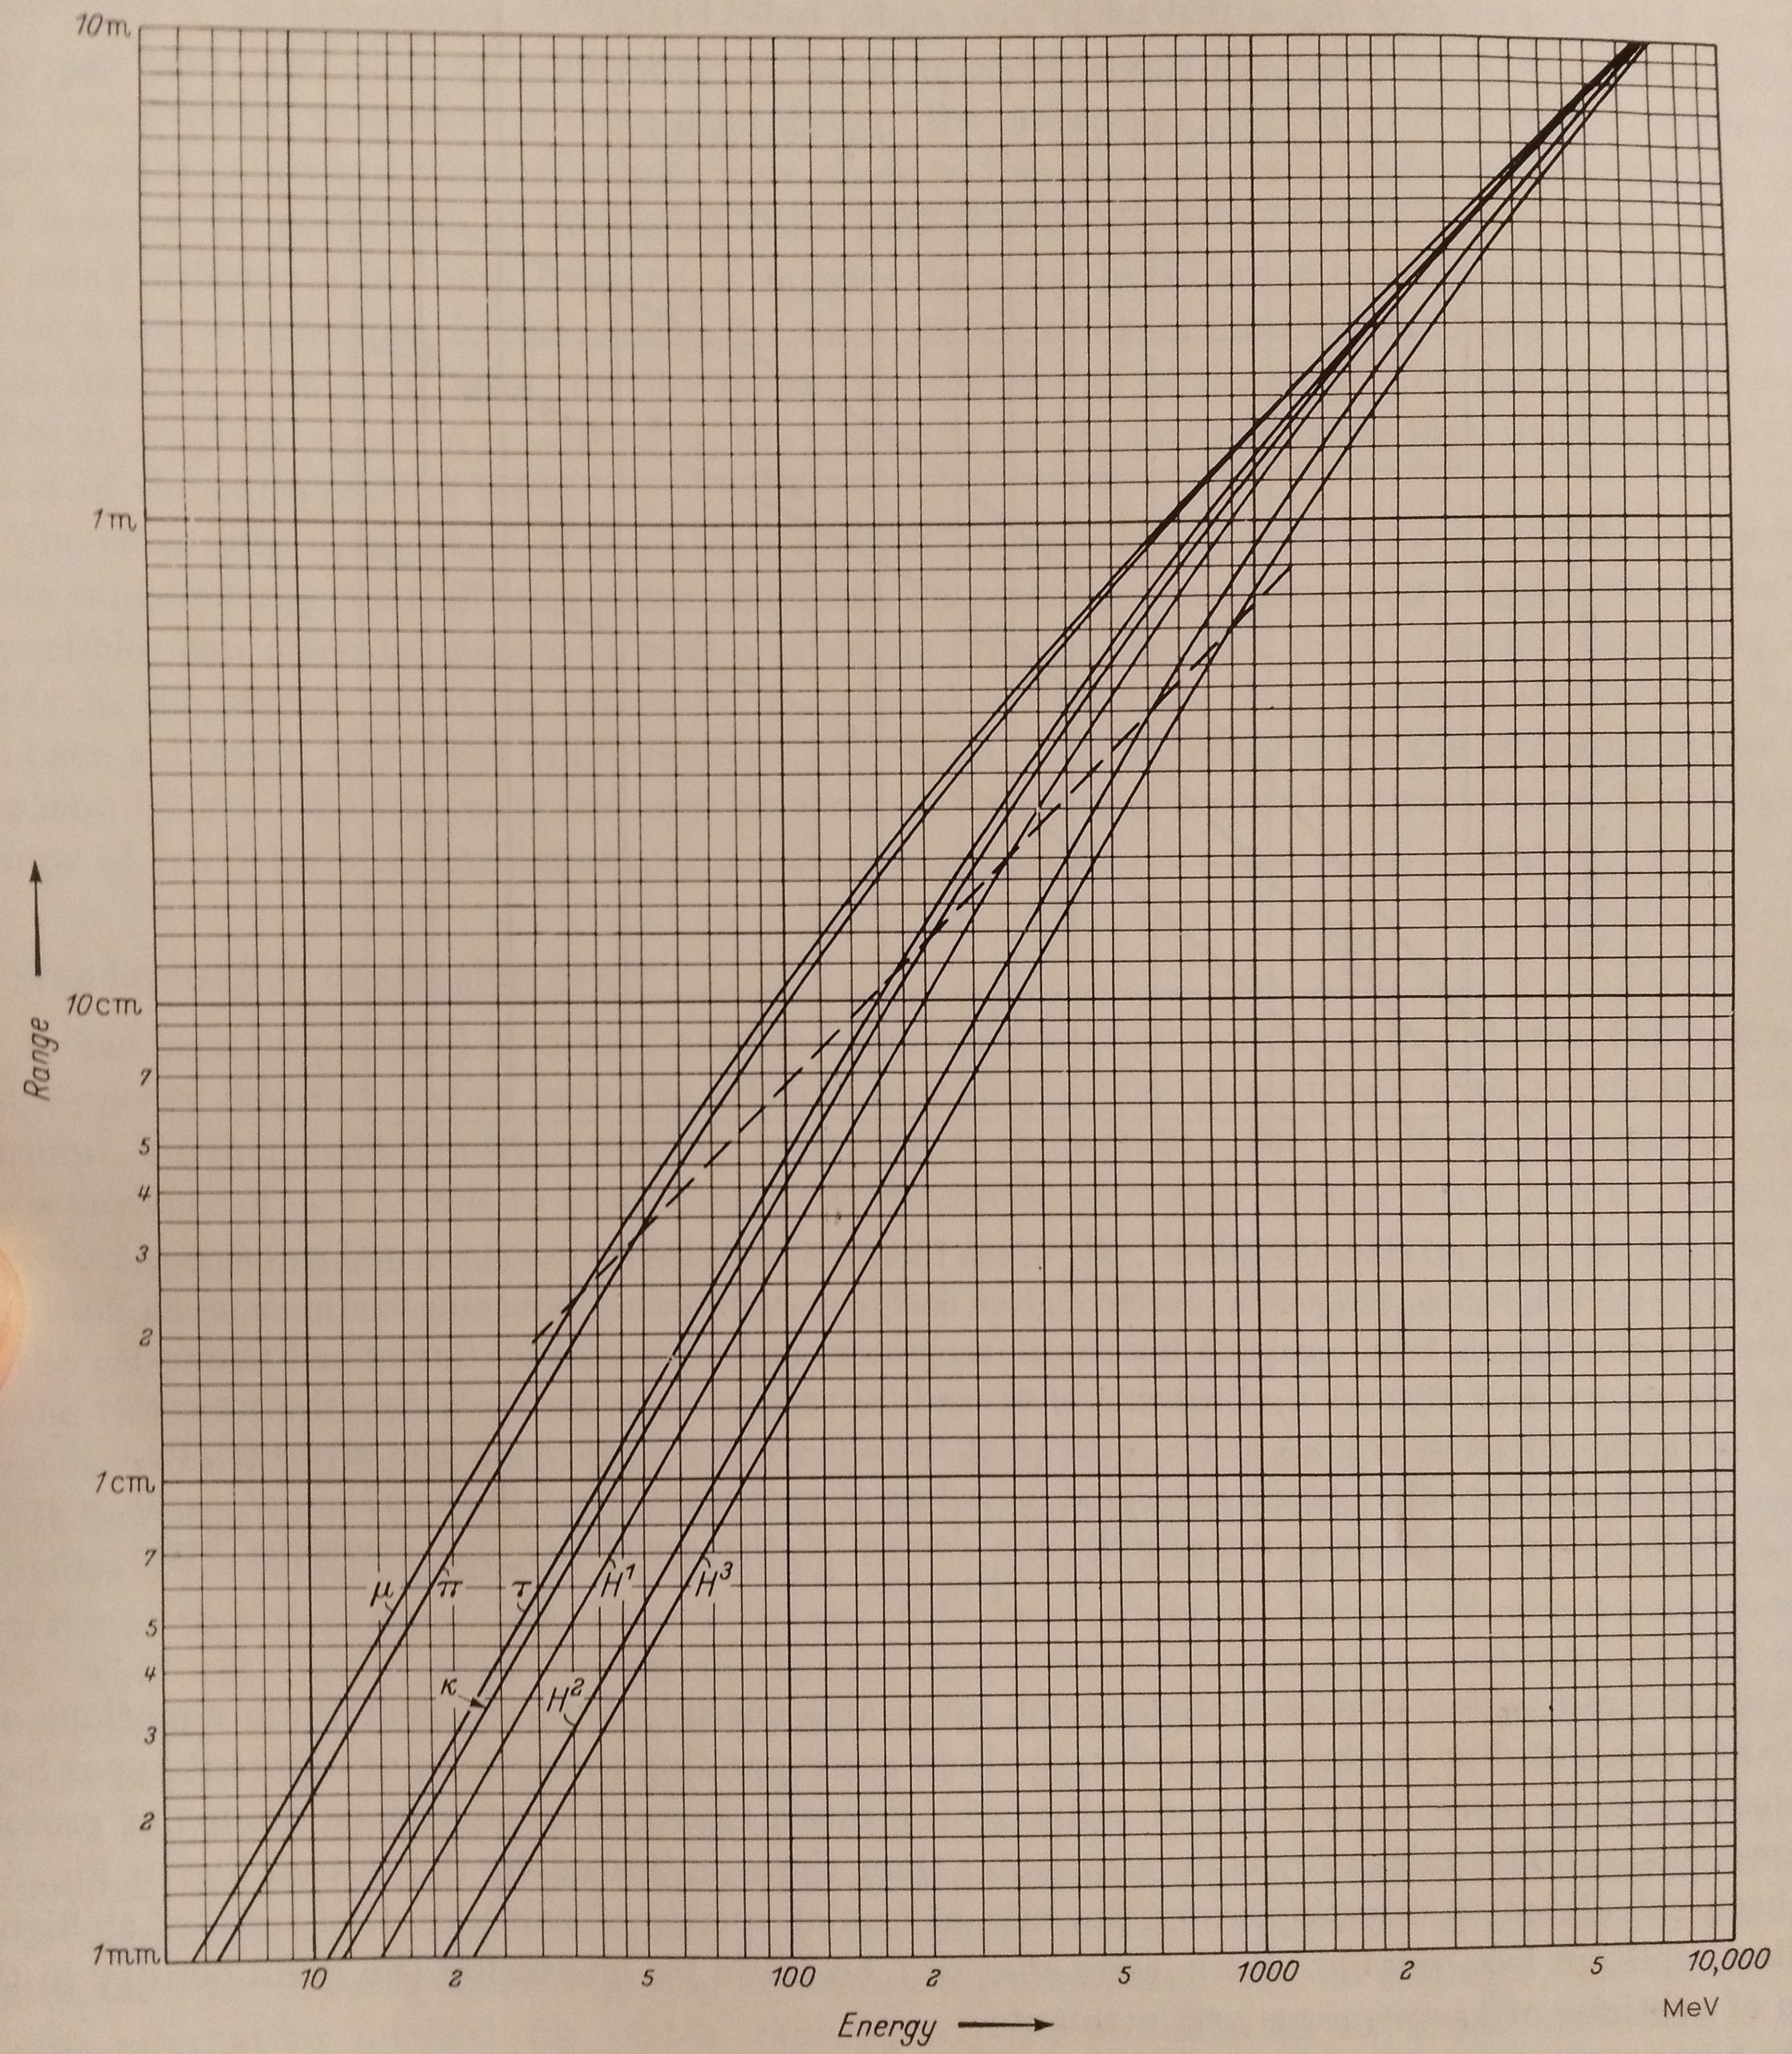
Range-energy relation for particles of different mass with ranges greater than 1 mm. The curves below the dotted line have been determined from reltion of the forms E=kRn and are consistent with experimental observations on protons with energies up to about 336 MeV. Above the dotted line, the curves have been extrapolated by estimating the rate of loss of energy dE/dR, of protons and other particles moving at different velocities. For emulsion of density 3,92 g /cm3.
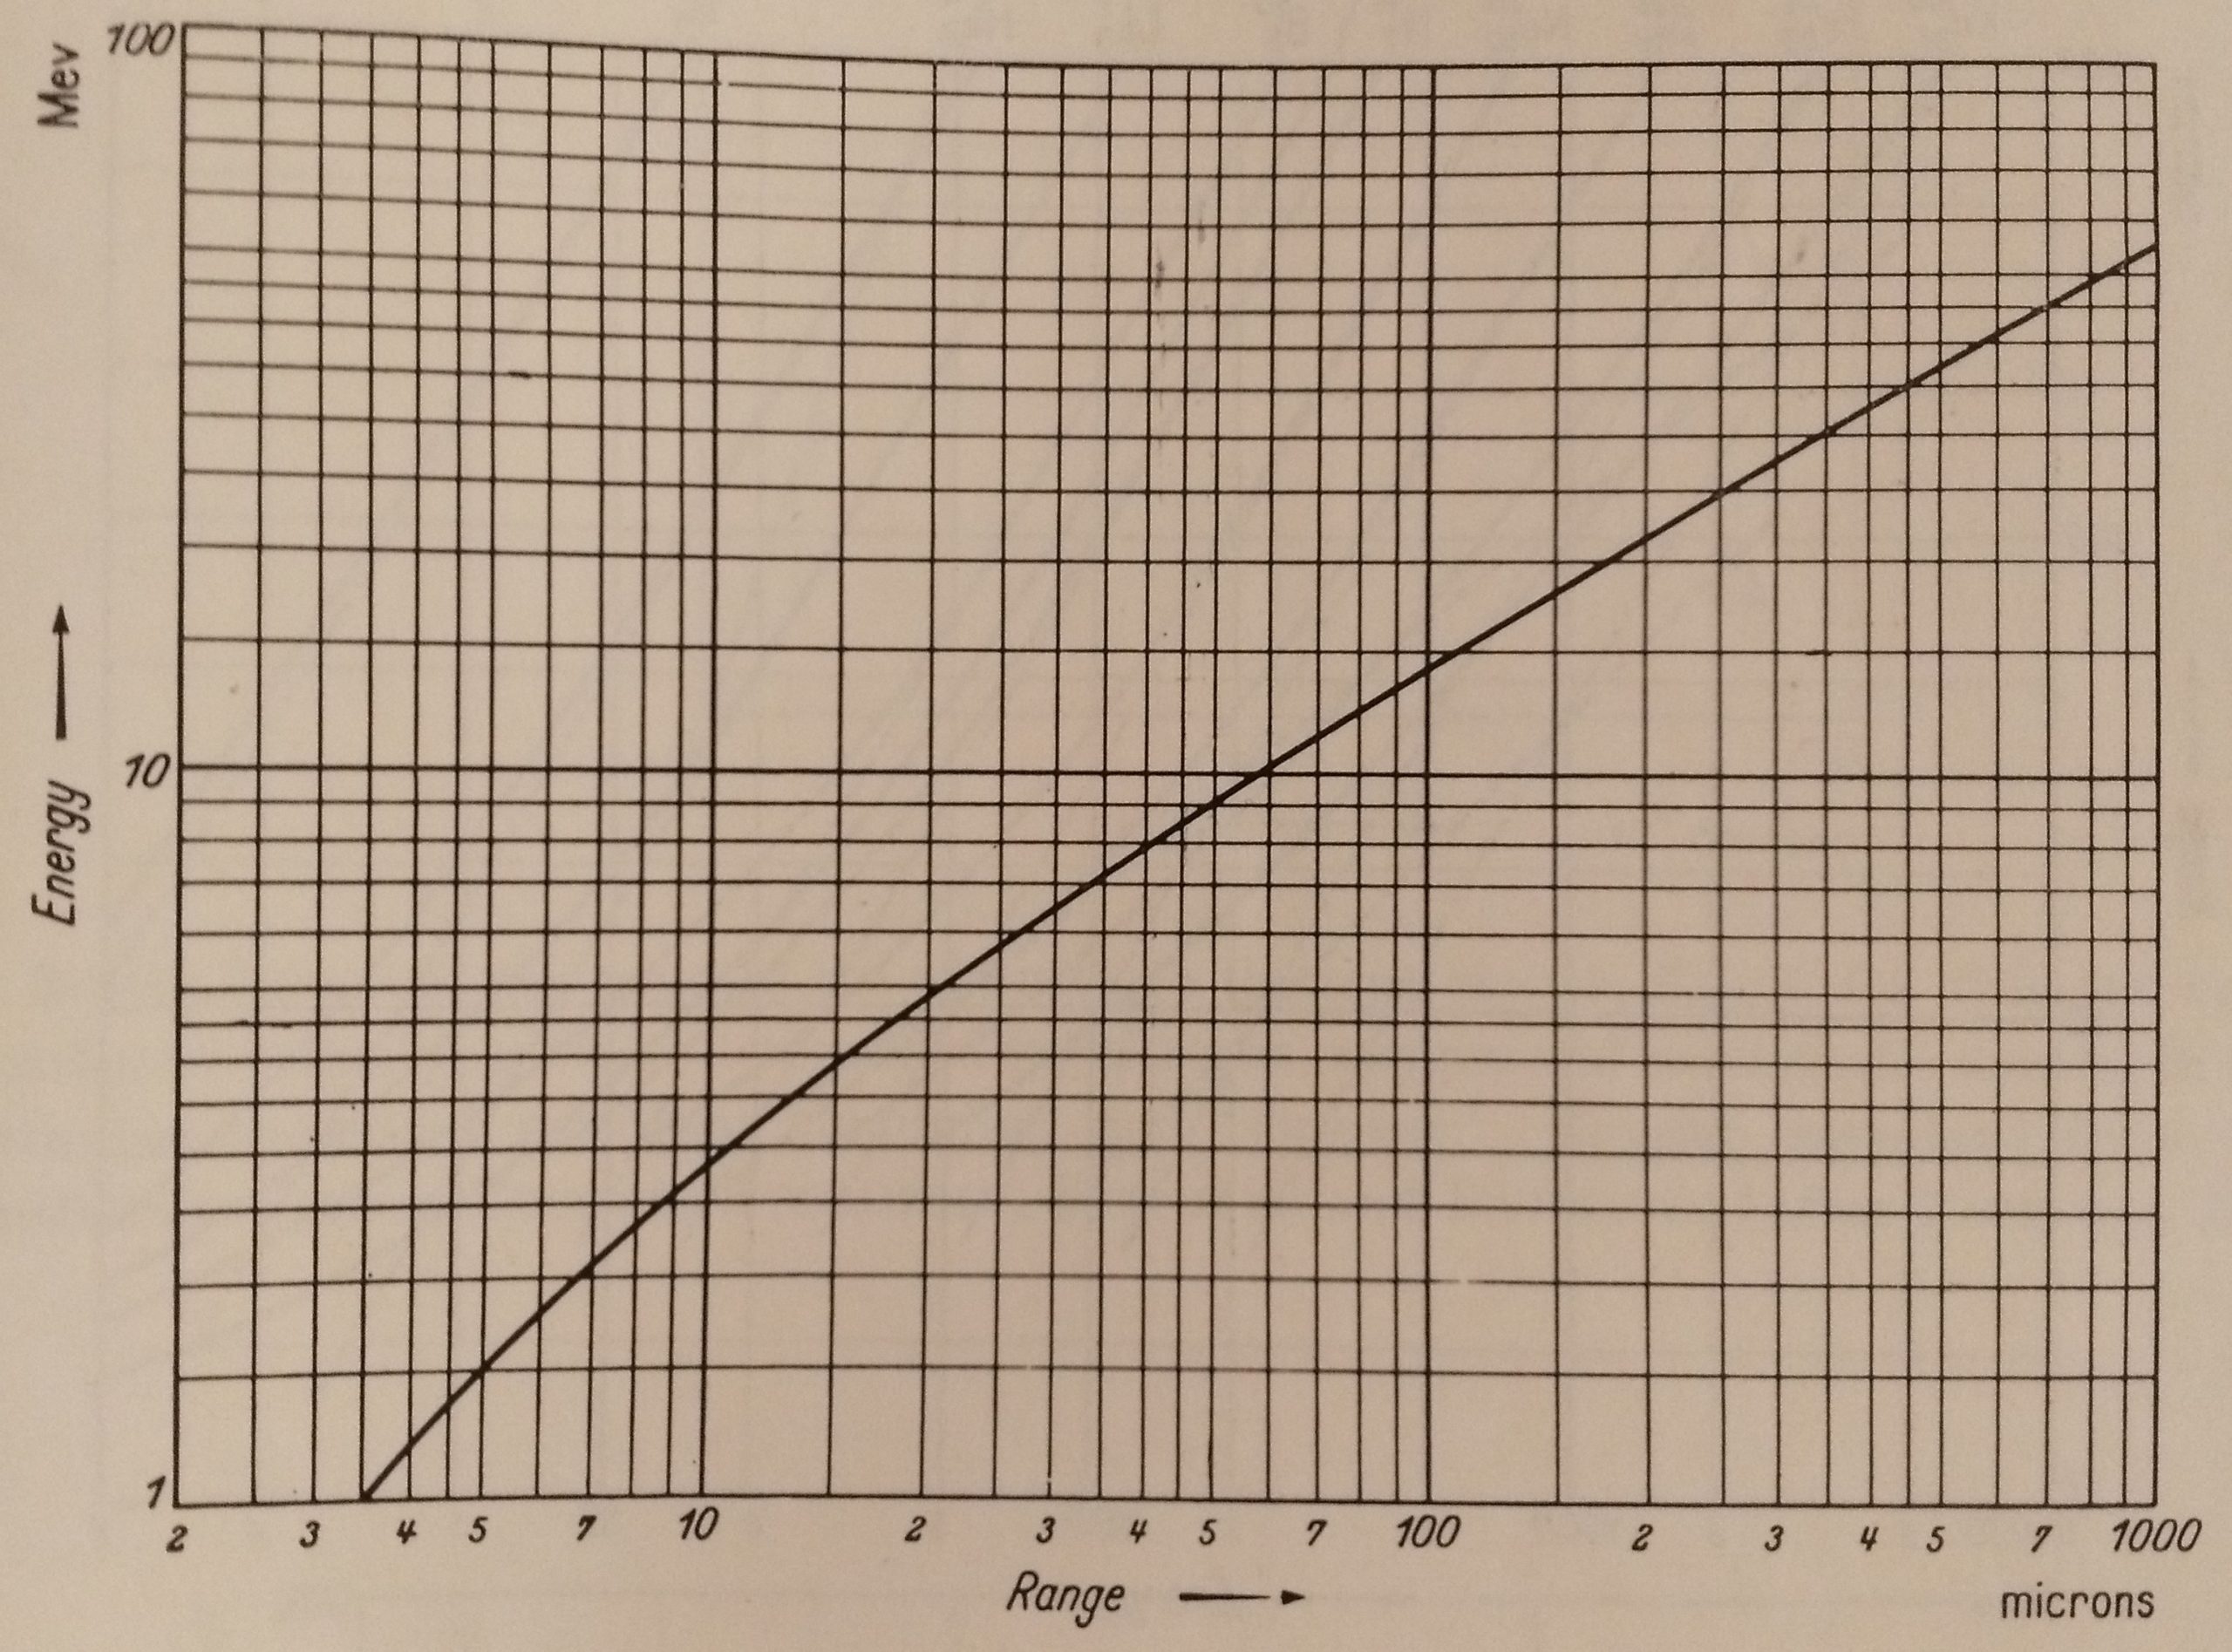
Range energy relation for alpha particle in emulsion.